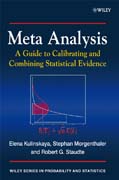
Meta analysis: a guide to calibrating and combining statistical evidence
Kulinskaya, Elena
Meta Analysis: A Guide to Calibrating and Combining Statistical Evidence acts as a source of basic methods for scientists wanting to combine evidence from different experiments. The authors aim to promote a deeper understanding of the notion of statistical evidence.The book is comprised of two parts – The Handbook, and The Theory. The Handbook is a guide for combining and interpreting experimental evidence to solve standard statistical problems. This section allows someone with a rudimentary knowledge in general statistics to apply the methods. The Theory provides the motivation, theory and results of simulation experiments to justify the methodology.This is a coherent introduction to the statistical concepts required to understand the authors’ thesis that evidence in a test statistic can often becalibrated when transformed to the right scale. Dr. E. Kulinskaya – Director, Statistical Advisory Service, ImperialCollege, London.Professor S. Morgenthaler – Chair of Applied Statistics, Ecole Polytechnique Fédérale de Lausanne, Switzerland. Professor Morgenthaler was Assistant Professor at Yale University prior to moving to EPFL and has chairedvarious ISI committees.Professor R. G. Staudte – Department of Statistical Science, La Trobe University, Melbourne. During his career at La Trobe he has served as Head of the Department of Statistical Science for five years and Head of the School of Mathematical and Statistical Sciences for two years. He was an AssociateEditor for the Journal of Statistical Planning & Inference for 4 years, and is a member of the American Statistical Association, the Sigma Xi Scientific Research Society and the Statistical Society of Australia. INDICE: Preface.Part I The Methods.1 What can the reader expect from this book?1.1 A calibration scale for evidence.1.2 The efficacy of glass ionomer versus resin sealants for prevention of caries.1.3 Measures of effect size for two populations.1.4 Summary.2 Independent measurements with known precision.2.1 Evidence for one-sided alternatives.2.2 Evidence for two-sided alternatives.2.3 Examples.3 Independent measurements with unknown precision.3.1 Effects and standardized effects.3.2 Paired comparisons.3.3 Examples.4 Comparing treatment to control.4.1 Equal unknown precision.4.2 Differing unknown precision.4.3 Examples.5 Comparing K treatments.5.1 Methodology.5.2 Examples.6 Evaluating risks.6.1 Methodology.6.2 Examples.7 Comparing risks.7.1 Methodology.7.2 Examples.8 Evaluating Poisson rates.8.1 Methodology.8.2 Example.9 Comparing Poisson rates.9.1 Methodology.9.2 Example.10 Goodness-of-fit testing.10.1 Methodology.10.2 Example.11 Evidence for heterogeneity of effects and transformed effects.11.1 Methodology.11.2 Examples.12 Combining evidence: fixed standardized effects model.12.1 Methodology.12.2 Examples.13 Combining evidence: random standardized effects mode.13.1 Methodology.13.2 Example..14 Meta-regression.14.1 Methodology.14.2 Commonly encountered situations.14.3 Examples.15 Accounting for publication bias.15.1 The downside of publishing.15.2 Examples.Part II The Theory.16 Calibrating evidence in a test.16.1 Evidence for one-sided alternatives.16.2 Random p-value behavior.16.3 Publication bias.16.4 Comparison with a Bayesian calibration.16.5 Summary.17 The basics of variance stabilizing transformations.17.1 Standardizing the sample mean.17.2 Variance stabilizing transformations.17.3 Poisson model example.17.4 Two-sided evidence from one-sided evidence.17.5 Summary.18 One-sample binomial tests.18.1 Variance stabilizing the risk estimator.18.2 Confidence intervals for p.18.3 Relative risk and odds ratio.18.4 Confidence intervals for small risks p.18.5 Summary.19 Two-sample binomial tests.19.1 Evidence for a positive effect.19.2 Confidence intervals for effect sizes.19.3 Estimating the risk difference.19.4 Relative risk and odds ratio.19.5 Recurrent urinary tract infections.19.6 Summary.20 Defining evidence in t-statistics.20.1 Example.20.2 Evidence in the Student t-statistic.20.3 The Key Inferential Function for Student’s model.20.4 Corrected evidence.20.5 A confidence interval for the standardized effect.20.6 Comparing evidence in t- and z-tests.20.7 Summary.21 Two-sample comparisons.21.1 Drop in systolic blood pressure.21.2 Defining the standardized effect.21.3 Evidence in the Welch statistic.21.4 Confidence intervals for d.21.5 Summary.22 Evidence in the chi-squared statistic.22.1 The noncentral chi-squared distribution.22.2 A vst for the noncentral chi-squared statistic.22.3 Simulation studies.22.4 Choosing the sample size.22.5 Evidence for l > l0.22.6 Summary.23 Evidence in F-tests.23.1 Variance stabilizing transformations for the noncentral F.23.2 The evidence distribution.23.3 The Key Inferential Function.23.4 The random effects model.23.5 Summary.24 Evidence in Cochran’s Q for heterogeneity of effects.24.1 Cochran’s Q: the fixed effects model.24.2 Simulation studies.24.3 Cochran’s Q: the random effects model.24.4 Summary.25 Combining evidence from K studies.25.1 Background and preliminary steps.25.2 Fixed standardized effects.25.3 Random transformed effects.25.4 Example: drop in systolic blood pressure.25.5 Summary.26 Correcting for publication bias.26.1 Publication bias.26.2 The truncated normal distribution.26.3 Bias correction based on censoring.26.4 Summary.27 Large-sample properties of variance stabilizing transformations.27.1 Existence of the variance stabilizing transformation.27.2 Tests and effect sizes.27.3 Power and efficiency.27.4 Summary.References.Index.
- ISBN: 978-0-470-02864-3
- Editorial: John Wiley & Sons
- Encuadernacion: Rústica
- Páginas: 282
- Fecha Publicación: 01/02/2008
- Nº Volúmenes: 1
- Idioma: Inglés
