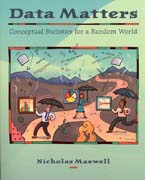
With an analytical approach that emphasizes concepts and comprehension, Data Matters provides a crucial introduction to statistics by preparing readers to think critically about the most common statistics found in the natural and social sciences. Real data and events taken from the daily news media bring relevance to the subject and turn the general reader into a critical and capable consumer of everyday statistics. With its pleasant, conversational style, Data Matters engages and interests readers while it covers the basics and lays a foundation for further study in statistics. INDICE: Foreword by George Cobb vii Preface To the Instructor ix To the Student xiii Acknowledgments xiv Introduction: Why Data Matters 1 Part I Statistics in the News 7 Basic Concepts of Statistical Thinking Presented in the Context of Categorical Data Chapter 1 Proportions in Samples, Proportions in Populations 8 1.1 The Most Popular News Statistics 9 Percentage, Proportions, Raw Counts, Pie Charts, Bar Charts 1.2 How Many People Are There? 36 U.S. and WorldPopulations, Population Growth, Proportional Changes, The Unemployment Rate, X-Y Plots 1.3 Things Vary, and Small Samples Vary the Most 54 The Law of LargeNumbers Chapter 2 The Pattern in Random Sample Proportions 73 2.1 Taking a Good Sample of a Population 74 Representative and Biased Samples, Random Sampling, Self-Selected Samples 2.2 How Samples Vary 94 Histograms, Bell Curves 2.3 How Widely Samples Vary 111 The Standard Error of a Proportion, The Normal Distribution Chapter 3 Making Inferences 132 3.1 Forecasting the Future 133 Prediction Intervals for Sample Proportions 3.2 What a Sample Reveals About a Population 150 Confidence Intervals for Proportions in Populations 3.3 The Story of Statistical Inference 170 Null Hypothesis, P-Value, Alpha, Significance Chapter 4 Testing Locations and Differences of Proportions 194 4.1 Testing Where a Proportion Is 195 The Z-Test 4.2 How to Look for Differences in Chances 213 Cross-Tabulations, Correlation, The Null Hypothesis of the Chi-Square Test 4.3 Checking for No Correlation with the Chi-Square Test 234 Chi-Square Distribution, Degrees of Freedom, Correlation Is Not Causation Chapter 5 Averages and Other Number Line Statistics in the News 257 5.1 Incomes and Other Quantities 258 Medians, Number Line Observations,Means 5.2 Which Tells the TruthThe Mean, theMedian. or 281 the Weighted Mean? Standard Deviation, Spread,Weighted Means 5.3 Inflation and the Consumer Price Index 302 Adjusting for Inflation Part II Statistics in Science 317 Descriptive and Inferential Statistics for Continuous Data Chapter 6 What Sample Data Distribution Reveals About the Population 318 6.1 Exploratory Data Analysis 319 Histograms, Stem-and-Leaf Plots, Box Plots6.2 Describing Number Line Variation 338 Standard Deviation of Samples,Variance 6.3 How to See the Future 360 Prediction Intervals for Number Line Observations and Sample Means, Standard Error of Means, Confidence Intervals for Population Means, Central Limit Theorem Chapter 7 Testing Treatments 378 7.1 A Cautionary Tale 380 William Gossets Troubles with the Z-Test and the T-Distribution, The T-Test 7.2 How to Test Whether a Treatment Works 399 The Logic of Experiments, Correlational Studies 7.3 Variances Between and Within 413 Estimating the Population Variance from Variation Within Groups and from Variation Between Group Means Chapter 8 Analysis of Variance 431 8.1 Fishers Analysis of Variance 432 Calculating Fishers F-Value 8.2 What If the Data Are Not Normally Distributed? 451 The Effect of Nonconstant Variances and Non-normality on ANOVA, Nonparametric Tests 8.3 American Counties 471 Correlation, Scatter Plots Chapter 9 Best Lines 495 9.1 Lines 496 How to Calculate the Equation of a Line 9.2 Finding Best-Fitting Lines 512 The Least Squares Line 9.3 An Excellent Line 522Calculating the Slope of the Regression Equation, Standard Error and Confidence Interval for the Regression Equation Chapter 10 Tests of Regression 544 10.1 How to Test the Regression Models 545 R2, Pearsons r, A T-Test for the Regression Slope 10.2 What If the Assumptions of the Regression Test Are Not Valid?568 Spearmans Rho, Effect of Nonconstant Variances on Correlation Tests, Effect of Non-normality on Correlation Tests, Nonlinear Regression Postscript: A Statistical Life 592 References 599 Index 609 Some Useful Equations 624
- ISBN: 978-0-470-41228-2
- Editorial: John Wiley & Sons
- Encuadernacion: Rústica
- Páginas: 625
- Fecha Publicación: 12/09/2008
- Nº Volúmenes: 1
- Idioma: Inglés
